Sheffield Greyhound Trap Statistics: Draw Bias Across Every Distance
Best Greyhound Betting Sites – Bet on Greyhounds in 2026
Loading...
Sheffield trap statistics tell a story that most casual punters never bother to read. Every greyhound race at Owlerton Stadium begins with six dogs loaded into six traps, numbered one through six from the inside rail outward, and from that moment the geometry of the track starts shaping the outcome. Trap draw is one of the most underrated factors in greyhound betting — a variable that sits in plain sight on the racecard yet rarely gets the analytical attention it deserves. At a track with a 425-metre circumference and a 62-metre run to the first turn, the starting position does not just influence where a dog ends up at the first bend. It can define the entire race.
This article breaks down how trap draw works in theory, what the Sheffield-specific numbers actually show, how the advantage shifts across different distances, and what happens to trap bias when the weather changes. The goal is not to give you a magic formula — greyhound racing resists formulas — but to give you a framework that turns a six-dog race into something you can analyse with more precision than gut feeling alone. If you have ever looked at a Sheffield racecard and wondered whether trap 1 really does win more often than trap 6, or whether that changes when it rains, you are in the right place.
How Trap Draw Affects Greyhound Race Outcomes
Start with the baseline. Six traps, six dogs, and if every dog had an identical chance of winning, each trap would produce a winner exactly 16.6% of the time. In a perfectly symmetrical world, trap draw would be irrelevant — a piece of trivia on the racecard rather than a meaningful piece of data. But greyhound tracks are not symmetrical, dogs are not identical, and the physics of six animals running into a bend at thirty-five miles per hour introduces biases that tilt the probability away from that clean 16.6% split.
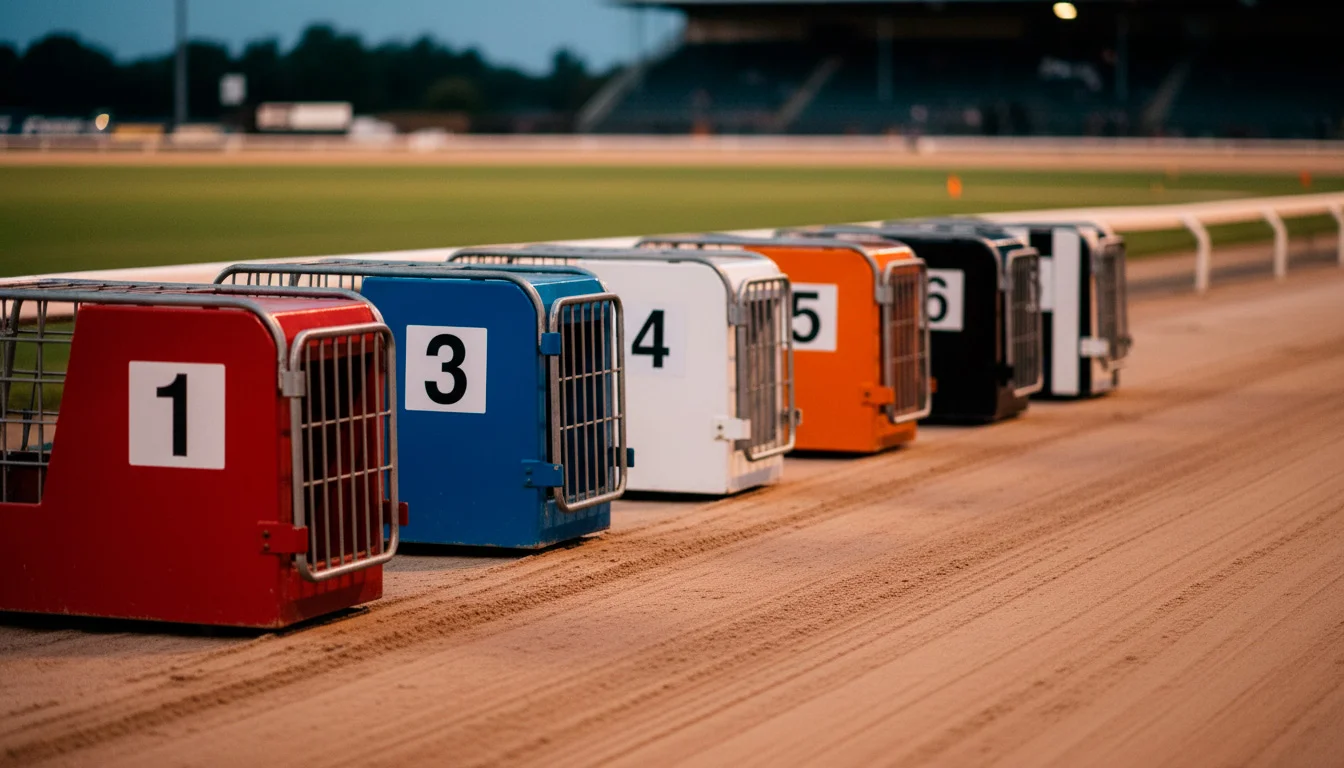
The fundamental mechanic is straightforward. Traps are positioned in a line across the track, with trap 1 closest to the inside rail and trap 6 on the far outside. When the lids fly open, every dog is trying to reach the first bend in the best possible position. Dogs from inside traps have a shorter path to the rail — the fastest route around any bend — while dogs from outside traps have to cover more ground to reach the same racing line. In a vacuum, this gives inside traps a raw geometrical advantage. The inside dog runs a tighter arc. The outside dog runs a wider one. Over the course of a bend, that difference translates into fractions of a second, and in a sport where races are decided by fractions, it matters.
But the vacuum does not exist. What actually happens at the first bend depends on a cascade of variables. The dog’s early speed determines whether it can use its trap position effectively. A fast beginner from trap 1 will grab the rail and dictate the race. A slow beginner from trap 1 will get squeezed and potentially bumped by dogs from higher traps cutting in. Meanwhile, a dog with explosive early pace from trap 6 might cross the field before the bend arrives and take up a leading position despite starting on the outside. Trap draw creates an opportunity, but the dog has to take it.
The run-up distance is the critical moderator. At tracks with short runs to the first bend — say, 30 or 40 metres — inside traps have a pronounced advantage because there simply is not enough straight for outside dogs to cross. The field reaches the bend before positions are fully established, and the dogs nearest the rail benefit from the compressed geometry. At tracks with longer runs, the advantage diffuses. Dogs have more time to find their position, early speed becomes more decisive than starting box, and the bias flattens. Owlerton’s 62-metre run to the first turn sits in the middle of this spectrum: long enough to give outside traps a fighting chance, short enough that inside traps still carry a measurable edge in certain race types.
There is also the matter of crowding. Six dogs converging on a single bend creates interference — bumping, checking, dogs being forced wide or pushed into the rail. The dogs most exposed to this interference are typically those in the middle traps, particularly traps 3 and 4, which find themselves caught between inside dogs holding the rail and outside dogs sweeping in. The irony is that trap 3, despite its apparent vulnerability to traffic, tends to show a slight statistical advantage across UK tracks overall. The explanation is nuanced: trap 3 dogs often inherit a clean run when the inside pair battle each other and the outside trio spread wide. It is not a guaranteed clean trip, but statistically, it happens often enough to show up in the data.
What none of this accounts for is the individual dog’s running style. Some dogs are natural rail-runners who will gravitate to the inside regardless of their starting position. Others are wide runners who produce their best form sweeping around the outside of the field. The racecard tells you a dog’s preferred style — the form figures and in-running comments are specifically designed to convey this — and the interaction between that style and the trap draw is where the real analytical value lies. A natural rail-runner from trap 1 is a different proposition entirely from a wide runner drawn in the same box. Same trap, same race, different probability.
Sheffield Trap Win Percentages: The Numbers
When you aggregate trap performance data across all UK greyhound tracks, a familiar pattern emerges. Trap 3 edges ahead of the field with a marginal overall advantage. Traps 1 and 2 tend to cluster slightly above the 16.6% expected baseline. Traps 5 and 6 typically fall slightly below it. Trap 4, depending on the track, floats around the mean. This is the broad national picture, and it holds up well enough as a starting point — but it is only a starting point, because individual tracks deviate from the national average in ways that matter.
At Sheffield, the trap data carries the signature of Owlerton’s specific geometry. The 62-metre run to the first bend is long enough that the inside-trap advantage is present but not overwhelming. Trap 1 benefits from rail proximity and tends to outperform the baseline across most distances, particularly in sprints where early position is decisive. Trap 2 performs similarly, though with slightly more variance depending on the quality of the dog’s early speed. Trap 3 at Owlerton, consistent with the national trend, holds its own — the middle position provides a blend of rail access and room to manoeuvre that works for dogs with tactical speed rather than pure explosive pace.
The outside traps — 4, 5 and 6 — are where Sheffield’s character becomes more interesting. At tracks with shorter runs to the first bend, these traps would show a clear disadvantage. At Owlerton, the 62-metre straight gives outside dogs a genuine window to establish position. Trap 6, in particular, benefits on certain distances because the dog has open space on its outside and can run without interference for the first few strides. The trade-off is distance: a trap 6 dog that does not lead or sit second into the first bend has a lot of ground to make up, and in a tight race, that ground rarely comes back.
What makes Sheffield-specific trap data genuinely valuable is that it moves you beyond these generalisations. The national averages tell you that trap 3 has a slight edge. Track-specific data tells you what happens to that edge at Sheffield over 480 metres versus 280 metres, on a dry Friday versus a rain-soaked Wednesday, with a field of graded dogs versus an Open race. The deeper you go into the numbers, the more the picture sharpens. Aggregate data is useful for orientation. Track-specific data is useful for betting.
For anyone serious about using trap data at Sheffield, the approach should be layered. Start with the overall trap win percentages as a backdrop. Then filter by distance, because the interaction between trap and distance is where the real signal lives. Then check recent form to see whether the dogs in the race are likely to use their trap position effectively. This layered method takes more time than glancing at the racecard and backing the favourite, but it also produces a more informed view of each race — which, over a season of 260-plus meetings, is the only edge that sustains itself.
How Distance Changes the Trap Advantage at Owlerton
Distance does not just change the type of race. It changes the mathematics of trap draw. At sprint distances, trap bias intensifies. At longer distances, it fades. Understanding why this happens — and how it applies specifically to Sheffield’s nine distances — is one of the more useful analytical tools available to anyone studying Owlerton racecards.
The 280-metre sprint is the clearest example. This race starts on the back straight and involves minimal bending. The field hits the first turn already spread out, and because the race is so short, there is almost no time for a dog in a poor position to recover. Early speed is everything, and the dog that breaks fastest from the boxes typically leads into the bend and never looks back. At this distance, inside traps — 1 and 2 — carry a stronger advantage than at any other trip. The rail is close, the bend arrives quickly, and a dog that grabs the inside line from the start has geometry working in its favour for the entire race. Outside traps can still win, but they need to break exceptionally fast to overcome the positional deficit.
At 362 metres, the dynamic is similar but slightly more forgiving. The extra distance gives the field another few strides to sort itself out, and dogs from traps 3 and 4 have more time to find racing room. The inside bias remains, but it is less absolute than at 280 metres. You start to see trap 3 performing closer to its national average here, and occasionally outperforming it, because the dogs in that position have enough straight to benefit from the middle-box clean-run effect we described earlier.
The 480-metre and 500-metre distances are where Sheffield does the bulk of its graded racing, and they represent the most balanced trap picture on the circuit. At these trips, dogs complete just over one full lap, encountering two sets of bends and enough straight to allow positional changes between them. The first bend still matters — it always matters — but a dog that gets checked at the first turn has enough race remaining to recover ground on the back straight and potentially challenge again at the final bend. This is why outside traps perform relatively better at 480 and 500 metres than they do at sprint distances. The extra distance dilutes the first-bend advantage and introduces other factors: stamina, racing intelligence, the ability to find gaps in a field that has spread out. Trap bias at these distances still exists, but it is subtler, and the quality of the individual dog becomes more important relative to the starting position.
Move into the staying distances — 660 and 720 metres — and the trap effect diminishes further. Over more than a lap and a half, dogs navigate multiple bends and have several opportunities to improve or lose position. The field tends to string out over these distances, reducing the crowding that makes the first bend so influential in shorter races. A strong stayer from trap 6 has more race in front of it to make up any early deficit, and the dogs that win at these distances tend to be the ones with the best sustained pace rather than the best starting position.
At the marathon distances — 800, 915 and 934 metres — trap draw becomes the least influential factor on the card. These races cover two full laps or more, involve multiple bends, and test endurance and racing temperament above everything else. A dog that panics in traffic or burns its energy too early will fade regardless of its trap. A dog that settles, runs efficiently and has the engine to sustain its effort over nearly a kilometre will find its way to the front eventually. This is not to say trap is irrelevant at marathon distances — no variable is ever truly irrelevant — but it is the factor you should weight least heavily when assessing a 915-metre race.
The practical takeaway is this: the shorter the race at Sheffield, the more you should weight trap draw in your assessment. At 280 metres, it should be near the top of your checklist. At 500 metres, it should be one factor among several. At 915 metres, it should be close to the bottom. This sliding scale is consistent across most UK tracks, but the specific breakpoints — where the bias sharpens, where it softens — depend on each track’s geometry, and at Owlerton, that 62-metre run and 425-metre circumference create a pattern that is distinct from what you would see at Monmore, Romford or Nottingham.
Rain, Sand and Track Conditions: Weather Effects on Trap Bias
Sheffield’s track surface is sand, and sand behaves differently depending on how much water it is carrying. On a dry evening, the surface is fast, consistent and relatively neutral in terms of trap bias. The sand is firm enough that dogs can maintain their speed through the bends without losing traction, and the running times tend to cluster closer together. On a wet evening, the picture changes. Rain saturates the surface, the sand becomes heavier, and the biomechanics of a greyhound running at speed through a turn shift in ways that favour specific positions.
The core principle is that wet tracks amplify inside-trap bias. When the sand is heavy and holding moisture, dogs on the outside of the field have to work harder through the bends. The wider arc they run becomes more demanding on a slower surface, and the energy cost of covering that extra ground increases. Inside dogs, running the tighter line closer to the rail, cover less distance and expend less energy per bend. Over the course of a race with two or more bends, this accumulates into a measurable advantage. Data across UK tracks confirms that on rain-affected surfaces, traps 1, 2 and 3 outperform their dry-weather averages, while traps 5 and 6 underperform.
At Owlerton specifically, this effect is worth tracking because Sheffield’s climate makes wet meetings common. The city sits in the eastern foothills of the Pennines and receives a fair amount of rainfall spread throughout the year — not dramatic coastal storms, but persistent drizzle and showers that can leave the track holding moisture for an entire meeting. The stadium’s ground staff water the track before racing to maintain an even surface, but when natural rainfall adds to the equation, the going can shift mid-card. This is something experienced Sheffield punters watch for: if the first three or four races on the card show inside traps winning at a higher rate than expected, it is often a signal that the surface is riding slower than usual and that the bias will persist through the evening.
Joe Scanlon, Chairman of the British Greyhound Racing Fund, has noted a broader concern about the pressure on the racing calendar. He pointed out that the number of stadia has reduced over time while the number of races staged has moved in the opposite direction, with both ARC and SIS competing for retail and online bookmaker customers, and that the impact on greyhound numbers is reaching a critical level. The relevance to track conditions is indirect but real: a packed racing schedule means tracks like Sheffield are in use multiple times per week, and the sand surface absorbs the wear. On weeks with heavy rain between meetings, the surface may not fully recover, and the conditions at a Thursday BAGS meeting can be different from those at a Saturday Open night even though both are nominally on the same track.
Temperature also plays a role, though it is less dramatic than rain. Cold weather can firm up the surface slightly, which tends to produce faster times and a more neutral trap picture. Frost is the main concern — if the sand freezes, racing is abandoned, though this is rare because the all-weather surface is designed to resist freezing at all but the most extreme temperatures. Summer heat, conversely, can dry the surface out faster than the watering schedule compensates for, producing a quick surface that rewards early speed and slightly reduces the inside-trap advantage because dogs can maintain their speed through wider arcs on a firmer track.
For practical purposes, the weather adjustment to your trap analysis at Sheffield comes down to a simple question before each meeting: has it rained today, and if so, how much? If the answer is yes and significantly, increase your weighting for traps 1, 2 and 3, particularly in sprint and standard-distance races where the first bend is most influential. If the answer is no and the surface is dry, treat the trap bias as closer to the neutral baseline. You are not going to get this right every time, but factoring weather into trap analysis gives you an edge over anyone who treats the numbers as static.
Applying Trap Bias Data to Your Sheffield Selections
The gap between knowing about trap bias and actually using it in your betting is wider than most people assume. Having the data is the easy part. The difficult part is integrating it into a decision-making process that also accounts for dog form, distance suitability, trainer patterns, track conditions and the unpredictable chaos that six dogs introduce every time the traps open. Trap data is one input in a multi-variable equation, and treating it as anything more than that will lead you astray just as surely as ignoring it entirely.
A workable framework for Sheffield looks something like this. First, check the distance. As we have established, trap bias matters most in sprints and least in marathons, so start by calibrating how much weight to give the trap based on the race distance. A 280-metre dash and a 915-metre marathon require fundamentally different analytical approaches, and the trap component of that analysis should reflect the difference.
Second, look at the trap draw alongside the dog’s running style. The racecard will tell you — through form figures and in-running comments — whether a dog is an inside runner, a wide runner, or something in between. A natural rail-runner drawn in trap 1 is a strong combination. A wide runner drawn in trap 1 is not necessarily bad, but it creates a potential conflict: the dog wants to run wide, but the trap position puts it on the inside, and the resulting path through the first bend may involve checking or bumping as the dog tries to find its preferred line. Conversely, a wide runner drawn in trap 6 has clear air on the outside and can run its natural race from the start. The best trap draw is not always trap 1 — it is the trap that best fits the dog.
Third, factor in the weather. If it has rained and the surface is heavy, shift your bias assessment towards the inside traps. If conditions are dry and fast, treat the bias as more neutral. This adjustment is not dramatic — you are not suddenly backing every trap 1 dog because it is drizzling — but it should nudge your probabilities. A marginal decision between two dogs where one has an inside trap on a wet night becomes less marginal.
Fourth, consider the competitive context. Trap bias data is an aggregate measure, drawn from hundreds or thousands of races. In any individual race, the specific dogs in the field matter more than the historical average. A strong dog from a statistically weak trap will still beat a weak dog from a statistically strong trap. The data tells you about structural tendencies, not deterministic outcomes. Use it to adjust your assessment at the margins, not to override the fundamentals of form analysis.
Finally, a word of caution. There is a temptation, once you discover trap bias data, to over-apply it. The numbers are real and the patterns are consistent, but they are also modest in magnitude. The difference between the strongest and weakest trap at Sheffield over any reasonable sample size is a few percentage points — meaningful over hundreds of bets, but barely noticeable in any single race. If you find yourself backing dogs solely because they are drawn in a favourable trap, you have gone too far. Trap draw is an ingredient, not a recipe. Combine it with form, distance, conditions and a disciplined approach to staking, and it becomes a useful part of your analytical toolkit at Owlerton. Treat it as a standalone system and it will disappoint you — not because the data is wrong, but because greyhound racing is too complex to reduce to a single variable, no matter how tempting that simplicity might be.